

 Česky
Česky |
Development of universally usable tools for analysts and portfolio managers |
RelativeValuesLab
Relative-Values is a trading approach that can include particular types of arbitrages, long/short strategy, pair-trading etc. The common factor of the approach is the fact that the trader looks for pairs of financial assets which have some “economical” connection between each other and tracks mutual (relative – hence the name of the approach) valuation of these two assets. In the event of distortion in the relative valuation, the trader finds a trading opportunity (so-called their own market) and the situation is used by opening trading positions which profi t from gradual disappearance of this “error” in the valuation. Long/short strategy, which is a part of the relative-values group, is the most commonly used trading strategy of hedge funds.
Case Study:
After the bankruptcy of Lehman Brothers, the market faced a situation when, due to global tensions and increased volatility, the prices of CDS on Czech government bonds were higher than prices of CDS on bonds of a Czech company ČEZ. Looking at this from the theory perspective which says that “risk of one company” = “risk of the country in which the company trades” + “specific risk of the industry/particular company”, this situation proves to be nonsensical and, therefore, temporary. The motivation of a relative values module user is to seek out these distortions in the real-time and take advantage of trading opportunities which are offered by these situations.
PatternLab
The business idea based on observing price patterns is very simple: if I observe a particular pattern (systematic error) in the price development, I receive market information about an emerging familiar situation and I know that I am observing a process in which I know what exactly is happening on the market. Traders call this situation “find your market”. Using this situation is intuitive – if I know who, why and what actions is someone performing in the market, I can place my own trade order according to the situation in a way so that I can participate in the price movement.
Practical use:
The trader who seeks oil futures trading opportunities chooses a price pattern which identifies the place of the expected price level breakthrough and afterwards inputs parameters of the respective trade (stop loss, profit target) and receives results within a moment. If the results are positive, the trader switches on notifi cations which inform them as soon as a pattern in oil (or any other observed asset) emerges. Take a look at the usage of the application.
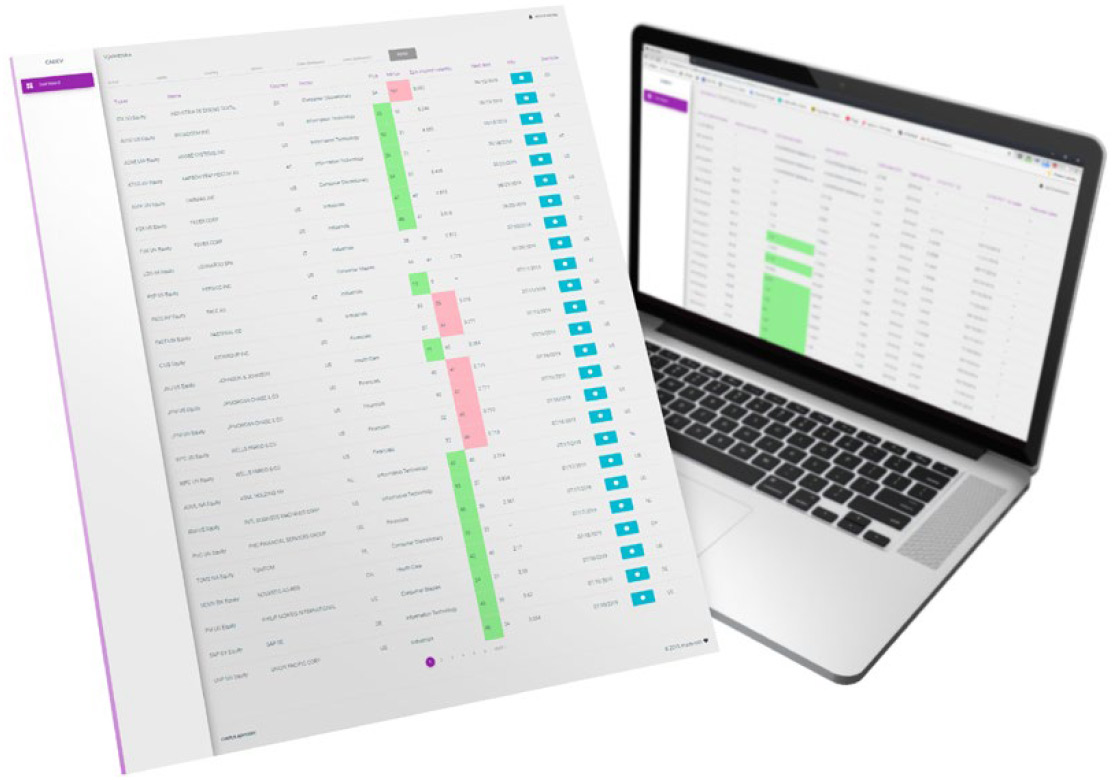
StockPickingLab
Find the most suitable stock titles by using our tailored tool. In our screener, you first intuitively choose filters which represent your selective criteria. As a result of your choice, the evaluation model is set up and it arranges in order “the best” titles for the current day. This module is appreciated especially by professionally proficient analysts.
Practical use:
Analysts/portfolio managers spend several hours by searching suitable stock for purchase every day. In our application, they can simply choose the basic investment features (currency, risk, investment horizon) and they will be presented with the best titles ranking within seconds.
 |
We develop turn-key analytical software |
ETF flow – Mood on US markets
Shows the sentiment of development of individual US economy sectors via instabilities of ETF flow representing US economy sectors. The moments, when the flow development is excessive, signalise overrating or, on the contrary, underrating of the respective sector. The use lies in observing the sentiment on broad stock markets, which offers analysts the necessary overview of the global fi nancial market development.
Indicator of the over-purchasing at ETF SPY with highlighted extremes:

Earnings
The application provides analysts with an overview of the currently announced results of companies which are being traded on the US and European markets (who announces the results, what are the expected results, the balance between differences and their estimates – how the price historically responded to the announcement). For example, an analyst observing Deutsche Boerse AG receives an overview of how markets absorbed new information in the last quarters.
BTSA – BackTesting and Strategies Analyzing App
Everyone developing own trading strategies knows to compare developed strategies performance is neccesary. Our R&D team has designed a diagnostical application based on an open-source library BackTrader. BTSA (abbreviation of BackTesting and Strategies Analyzing) serves for backtesting of developed strategies and analyzing their performance. With BTSA users gain tool which delivers useful information such as YTD, maximum drawdown, Sharpe Ratio and it all for analyzed strategy and for underlying asset as well. BTSA designs important benchmark for developed strategy.