

 Česky
ČeskyOverview
StockPickingModel is the AI-powered data tool for smart decision-making process in the stock market. Our research team have developed a model for market inefficiency exploitation (researchers call it no-arbitrage condition violation). Stock portfolio can be designed with the tool to ’beat the market’. The Stock-Picking Model for stock ranking is based on expected risk-adjusted returns.
The model focuses on a representative universe of US stocks DJIA, SP100, SP500 and Russel 2000 with investment horizons ranging 1-week, 1-month, 3-moths and 6-months.
Predictor Types
Firm-Specific: The model uses firm-specific and macro predictors. The statistical firm-specific variables include momentum, statistical moments, trading volumes, technical analysis indicators, dividend payout yield, standardised unexplained volume (SUV) and autoregressive factors. Fundamental firm-specific variables include financial ratios, market capitalisation, dividend yield and others.
Macro predictors: Yahoo indices, stock indices returns, realised volatility, bond indices data, financial activity measures, commercial banking indicators, monetary data, employment data, national income, international trade and others.
Method
The goal is to develop a model that estimates the normalized return of the monitored stock.
There are nine submodels, all of them are estimated on the crosssectional dataset of NxT size and tested with: ridge linear regression, elastic-net linear regression, feed-forward neural network with continuous targets, elastic-net logistic regression, feed-forward neural network with binary targets.
Results
The compound annual growth rate is 17.69 % while the maximum drawdown is -13.72 % during the 2008 – 2020 period. The selection and testing is full-sample so there is no overfitting in the model.
Conclusions
The results show excessive rate of return in comparison to the benchmarks (stock indices DJIA, SP500). The model is reinforcing with Bayesian procedure (Dynamic Bayesian Selection of Factors) to identify valid factors (with positive expected returns).
Practical Use
The Stockpicking Model recommends the most suitable stocks for building a long & short portfolio. In our own portfolio, we always hold in the Long position (we speculate on growth) 20 shares, for which we expect the largest growth, and 20 shares in the Short position (we speculate on a decline), for which we expect the largest decline. When testing, the lower number of shares achieved higher performance, but at the same time larger declines, and vice versa. 40 shares were therefore chosen as the ideal portfolio.
Long positions are bought for about $ 750 (for example, if Apple Inc. [AAPL] shares cost $ 351, we buy 2 shares for $ 702), short positions for about $ 500. The portfolio is rebalanced once a month. We select from the S&P 100 index, which includes the shares of the 100 largest listed companies on the US stock exchange.
The performance in real operation is shown in the table. In the first month of trading, we achieved a 5% yield.
Disclaimer
The model was developed in cooperation with CCF RESEARCH, a.s., Mendel University in Brno and University of Economics in Prague.
We provide an analytical report as the output of the developed software for analysts in the capital markets. This is by no means an investment recommendation. We do not provide any financial services. Our activity is the development of software based on AI methods. For more information or cooperation with our company, do not hesitate to contact us.
Backtested portfolio performance graph
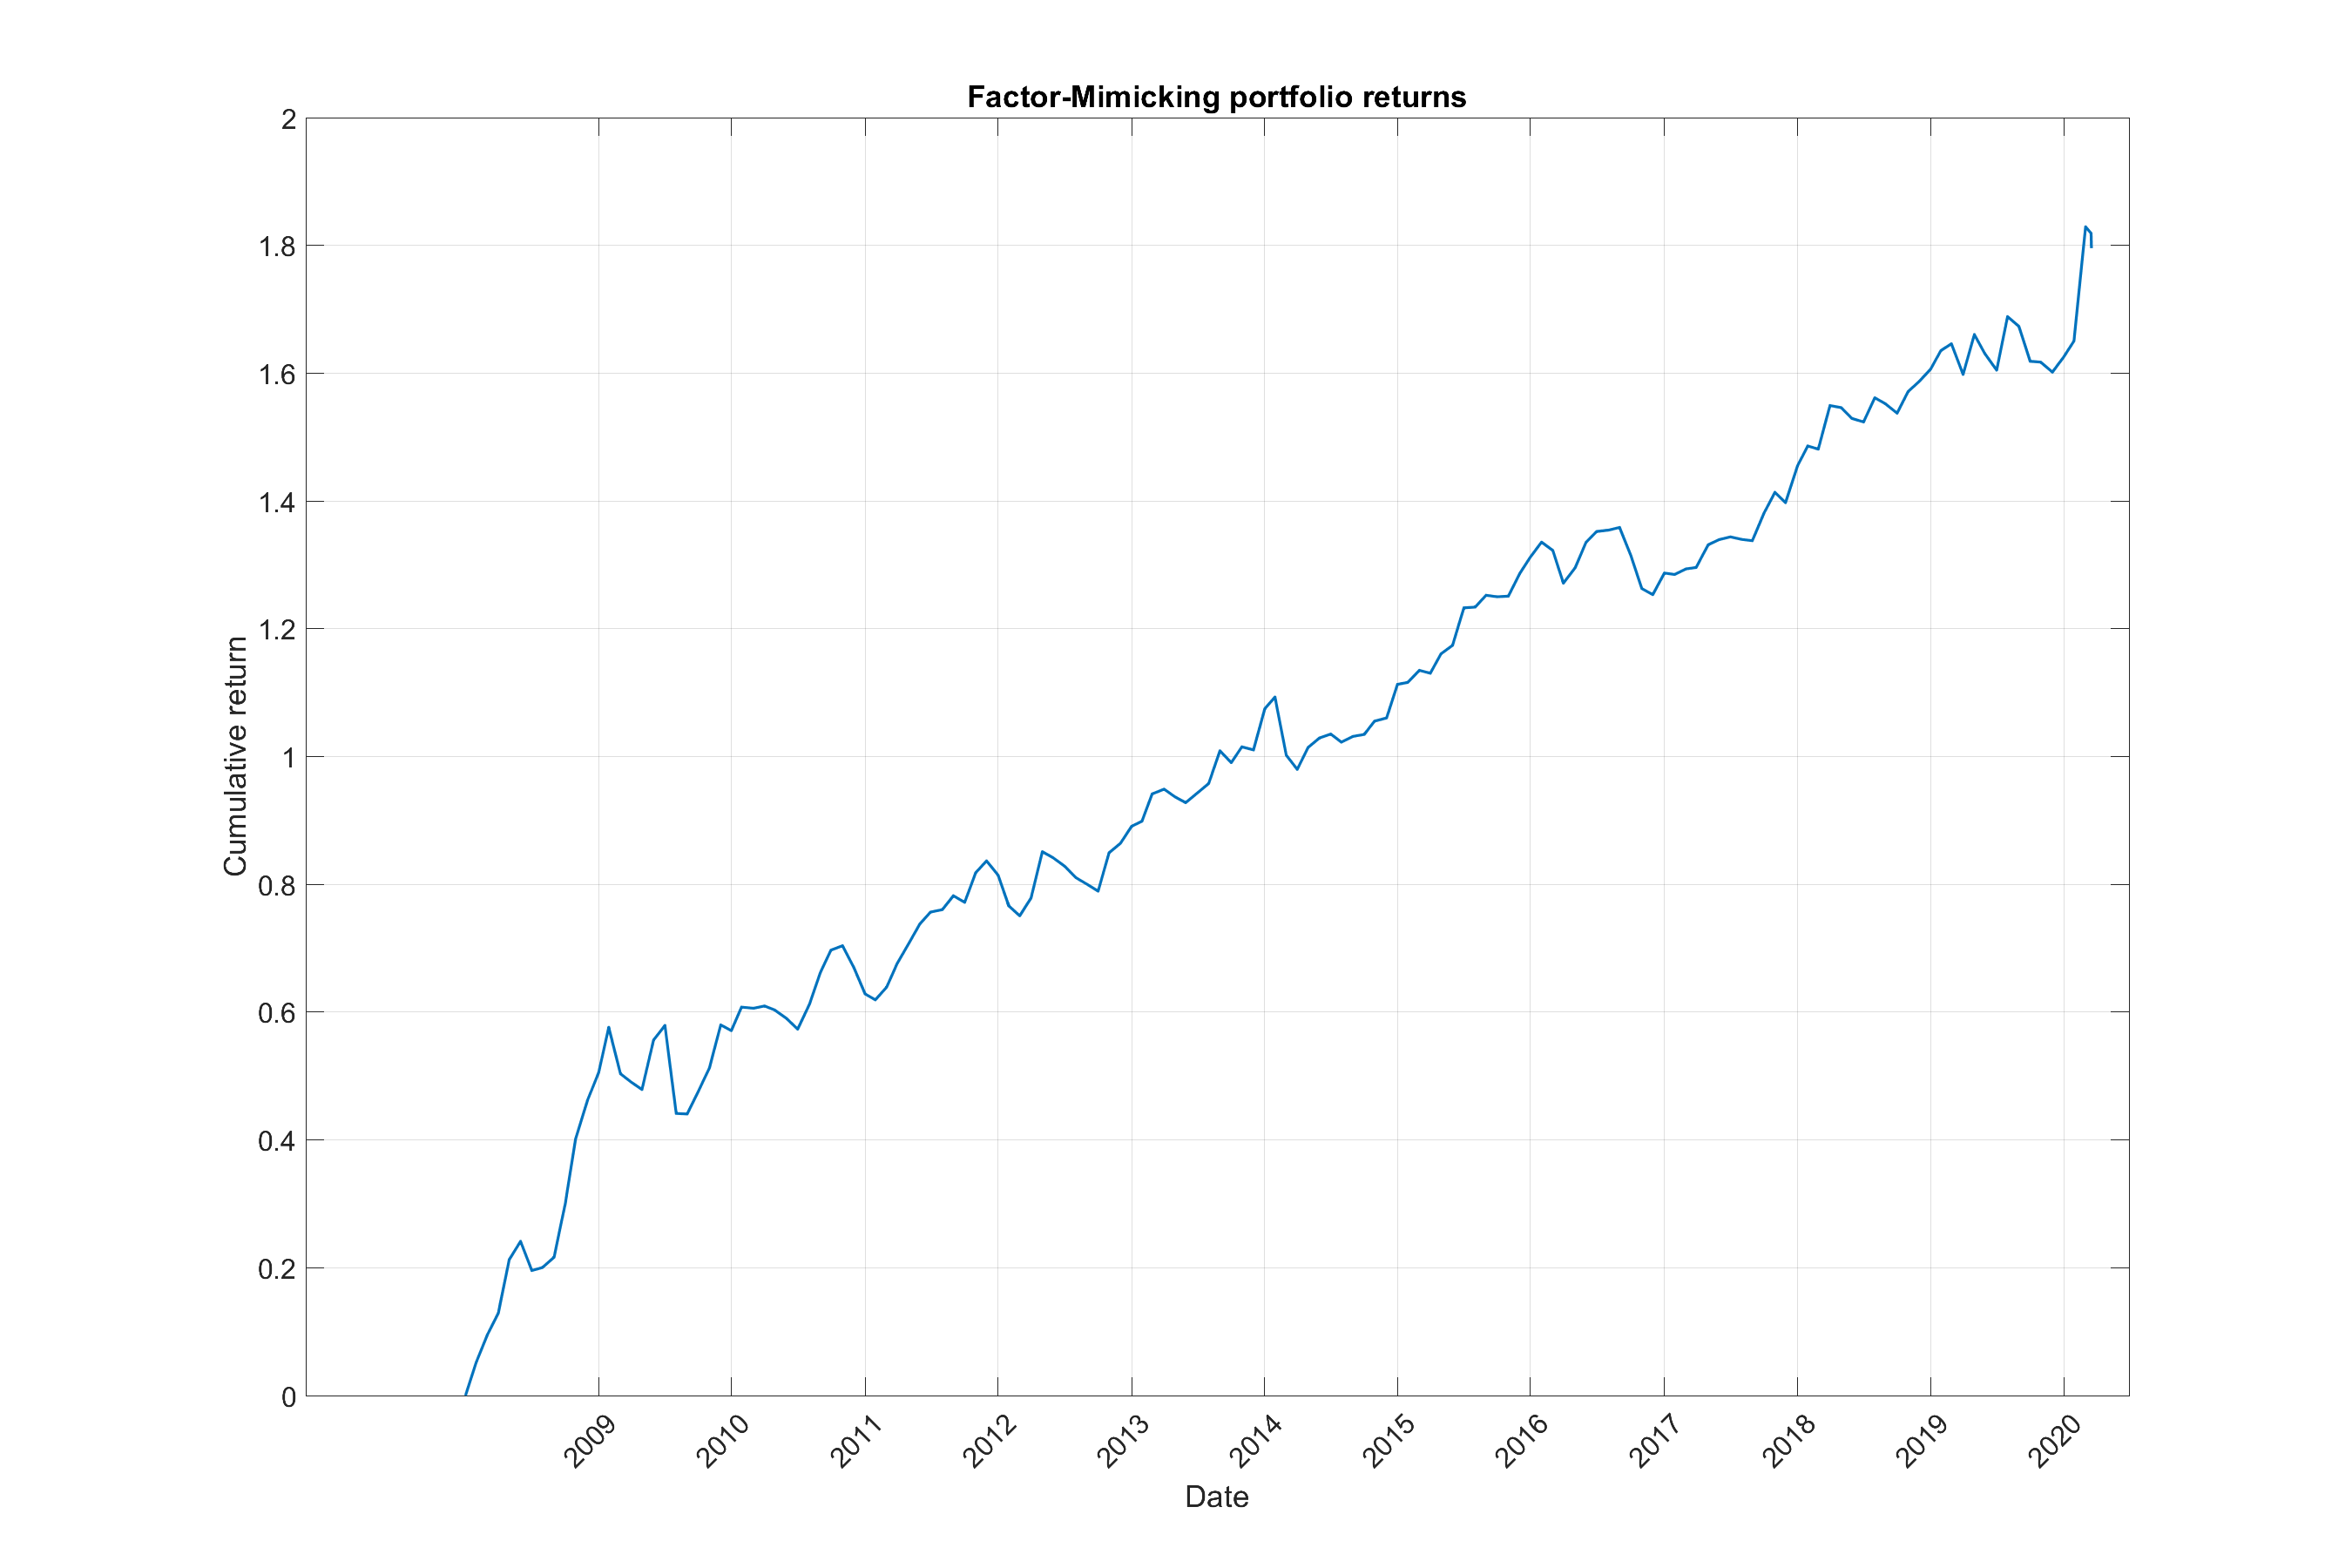
The graph is linearized. This means that all profits are withdrawn and only the initial capital is invested furthermore.